l拉氏图不用过多介绍,主要是用来评价模型的,这次在网上找到一个作图挺好看的拉氏图软件,推举给大家,
github地址: https://github.com/mungpeter/RAMAplot
或者点此下载
1. 安装
首先安装依赖包
|
|
下载:
|
|
2. pdb转换为fasta工具
不太适用于非标准氨基酸残基,需要自己添加
|
|
其主要是运用了biopython的操作pdb工具,将其转换后重新建立peptides虽然读取序列
|
|
感觉不太智能,直接撸可能更好,当然也可以用get_resname()函数再通过3字母转化
|
|
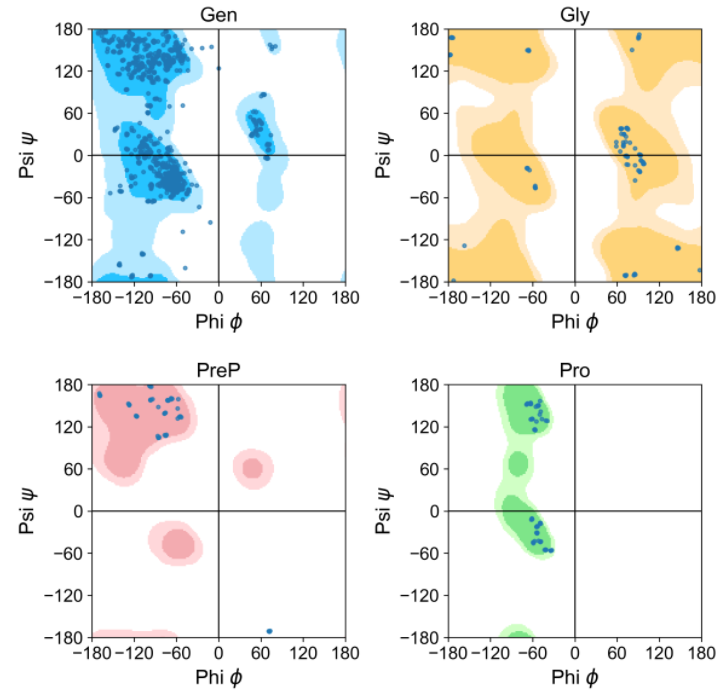
3. 单结构拉氏图
|
|
其会制作“Proline”, “Pre-Proline”, “Glycine”, “General"四种类型的图
查看源码可以发现其主要包含三个模块:
第一个模块是读取参考图像数据 RefRamaData
|
|
第二个是读取输入残基的数据 InputRamaData
|
|
最后是作图GeneraterImage:
|
|
还挺简单的,值得我这种刚入门的学习
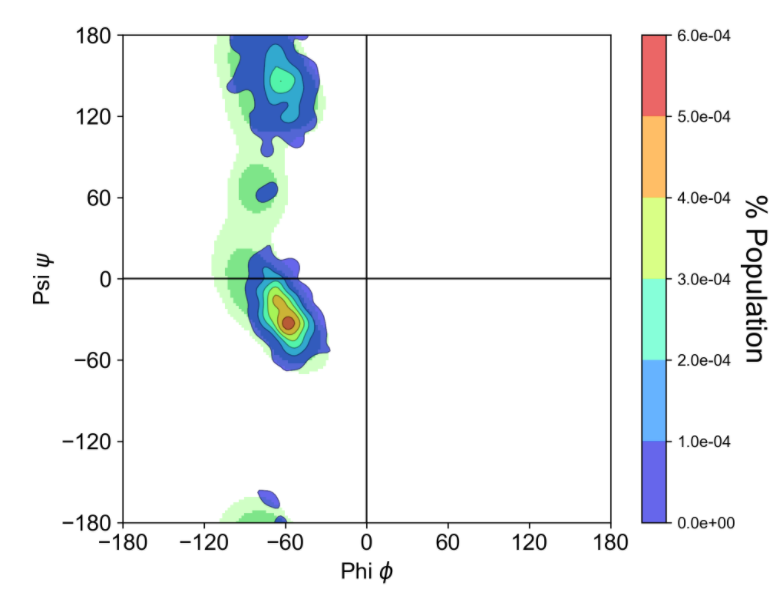
4. 单原子拉氏图轨迹
|
|
图是真好看: